Use of a subspace model is a viable method to characterize process space variables and optimize process performance.
By Colin Jaques, Daniela Lega
 Over the past decade, two improved capabilities have changed the face of bioprocess design. First, the availability of high-throughput miniature bioreactors has made it possible to evaluate many more conditions. This has enabled design of experiment (DoE) approaches, such as response surface optimization, to be used. Second, better systems for collecting, storing, and analyzing process data have facilitated the application of multivariate data analysis (MVDA) to historical bioprocess data. These developments have been timely, as regulatory authorities’ requirement for better understanding of product and process has encouraged a process-space approach to bioprocess development.
Characterizing high-dimensional process spaces
Historically, bioprocess outputs were generally characterized one factor at a time for a moderate number of values for each factor (Figure 1).The different levels of a factor that are being investigated are best imagined as points along a line (i.e., the x-axis). This line equates to a one-dimensional process space. A model can be fitted to the data, and the optimal value for that factor can be predicted. That optimal value obtained is only valid, however, when all other parameters are equal to the values used in the experiment.
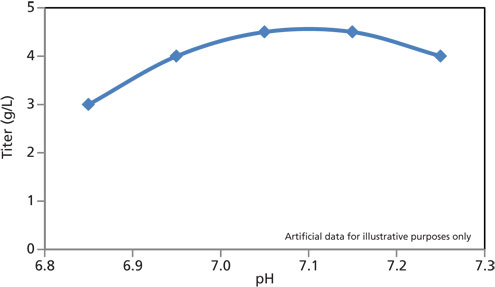 Figure 1: Characterization of a model one-dimensional process space spanning a range of pH values.
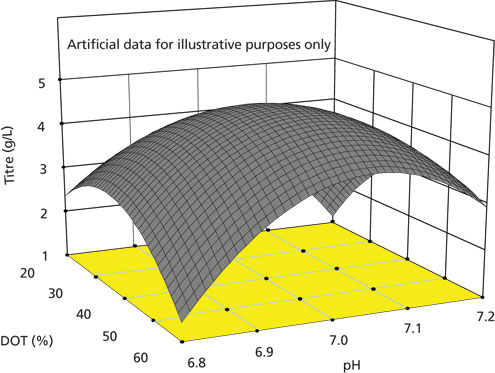 Figure 2: Characterization of titer at harvest for a model two-dimensional process space spanning a range of dissolved oxygen tension (DOT) and pH values.
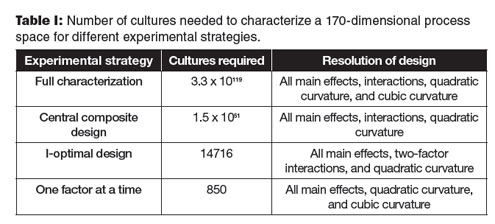
One approach to exploring high-dimensional spaces is to consider only a subspace of the overall space. An example of this in practice is best illustrated by the creation of maps that are used for navigational purposes. We live in a four-dimensional world of space and time; however, carrying a four-dimensional map around is not convenient. Over small distances, the surface of the earth approximates to a two-dimensional plane in three-dimensional space. The features of the earth don’t change much over short periods of time. By collapsing the two dimensions with the least useful information (i.e., height and time), a useful navigational map can be made in a two-dimensional subspace.
A subspace approach can be useful for reducing the number of cultures required to characterize a process space, but how should an investigator select which factors to characterize? Historically, figuring which factors to characterize has relied heavily on the knowledge of process experts. MVDA provides tools for summarizing complex process data, which can help in the identification of the relevant process factors.
Example of a process optimization
The aforementioned approach to process optimization can be illustrated with an example (using artificial data) of the optimization of an existing platform process to better fit a new host-cell line. When a new host-cell line is introduced, the starting point for the process will usually be the existing platform process that was originally designed for the previous host-cell line. In this example, the existing process gave satisfactory performance with the majority of cell lines derived from the new host; however, a small proportion of cell lines displayed poor metabolism and poor viability towards harvest. While it is possible to weed the poorly performing cell lines out during the cell-line selection process, it is desirable to have a platform process that is as broadly applicable as possible. To this end, a program of process optimization was undertaken.
Data generated in the old platform process during the development of the cell-line construction (CLC) procedure for this host were analyzed by the MVDA technique called principal components analysis (PCA). PCA finds an alternative set of orthogonal axes (principal components) through the data. These principal components are arranged such that the first principal component (PC1) captures the maximum possible variance from the data set (equivalent to the line of best fit though the data set). The second principal component (PC2) captures the maximum possible variance left in the data set once the variance associated with PC1 is removed. In this way, most of the behavior present in a high-dimensional data set can be summarized in a lower number of dimensions.
Multiple CLCs were performed, with each round generating multiple cell lines. Data were available for 15 measurements over 16 time points for 20 cultures (19 Chinese hamster ovary cell lines) making the same recombinant monoclonal antibody (mAb) giving a 240-dimensional data set. The first two principal components (PC1 and PC2) accounted for 46% of the behavior in the data set. The scores and loadings for these PCs are plotted in Figure 3. The PCA scores clustered according to the different CLC rounds. The CLC rounds each used slight variations of the CLC method. The ability of PCA to distinguish between the rounds indicated that the method was summarizing biologically relevant behavior.
The loadings of the PCA model were examined to gain insight into the behavior of the cultures. Loadings on PC1 were heavily influenced by growth, osmolality, and amino acid concentrations. The feed system of the platform process was linked to the viable cell concentration. The correlation observed with cell concentration osmolality and amino acid concentrations suggested that the feeding regime might not be optimal for cell lines derived from the new host. As a result, amino acid analysis was performed on supernatant samples from these cultures and concentrations of a number of amino acids were selected for optimization.
Loadings on PC2 were heavily influenced by culture metabolism and viability. Loadings for lactate concentration pCO2 and sodium concentration were inversely correlated with loadings for viability. Sodium concentration and pCO2 are determined by lactate metabolism, and as all three were inversely correlated with viability, lactate metabolism was selected for further investigation. Lactate metabolism is known to be influenced by pH and by the concentrations of key trace elements. For this reason, trace element analysis was performed on supernatant samples for the historical cultures, and trace elements with suboptimal concentrations were selected for optimization.
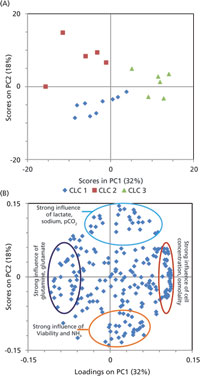 Figure 3: (A) Scores and (B) loadings plots from principal components analysis (PCA) of historical cultures. Scores are colored by cell-line construction (CLC) round.
As an example of the response surfaces generated, the response of viability at harvest to initial and final pH is presented in Figure 4. Based on an analysis of the results, pH had the single largest impact on viability at harvest (Figure 4A) of all the factors investigated. However, by optimising the levels of the other nine factors in the experiment, it was possible to increase the viability at harvest further and to make the viability at harvest less sensitive to process pH opening up a larger process design space for further process optimization and simplification (Figure 4B).
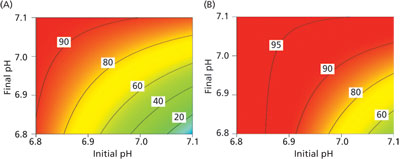 Figure 4: Response surface model predictions of viability at harvest as a function of initial and final pH for (A) the original process, and (B) the optimized process.
The derived models were used to perform simultaneous in silico optimization of multiple process outputs. Optimization focused on increasing viability at harvest, reducing lactate accumulation at harvest, and maintaining antibody concentration at harvest. The optimized process was evaluated with two cell lines in 10-L airlift reactors. Cell line 1 was known to display acceptable lactate metabolism and culture viability at harvest. Cell line 2 was known to display unacceptable lactate metabolism and culture viability at harvest. Profiles for lactate concentration and culture viability in both processes for both cell lines are presented in Figure 5A and 5B. Lactate concentration at harvest was decreased for both cell lines, and the onset of late-lactate accumulation was delayed in the new process. Viability at harvest was substantially increased for both cell lines with positive implications for the downstream process.

Conclusion
Automated miniature bioreactors and advanced statistical techniques such as multivariate data analysis and response surface optimization now available to the bioprocess developer are changing the face of bioprocess development. By applying these tools in a single round of optimization, it is possible to make substantial improvements to a mature platform process and optimize process conditions for cell lines derived from a new host. However, advances in high-throughput analytics, data processing, and medium and feed preparation are also warranted.
About the Authors
Colin Jaques is senior principal scientist, research and technology, and Daniela Lega is lead scientist, research and technology; both at Lonza Biologics.