Establishing a Process Control Strategy
Once the initial design is in place, a process control strategy will be developed to ensure the process delivers a product that meets the CQAs.

First, a P-Diagram (Figure 3) is generated per unit operation to identify all parameter inputs and outputs for each step. This tool is a good visual aid for process understanding and is also used to populate a customized risk-assessment tool called the Risk Assessment Mitigation Matrix (RAMM), as shown in Figure 4.

The RAMM tool is specifically designed to identify CPPs (3). This tool allows evaluation of what input parameters contribute the most variation to individual outputs. The outputs are scored on their potential to impact the CQAs. Scores are based upon three values, as shown in Figure 4 (1=green, 3=yellow, 9=red) to obtain separation and clearly identify criticality. The result of the analysis for each unit operation is a list of potential CPPs. The scores in each row are totaled to understand CPPs, and the scores in each column are totaled to understand an output's influence on CQAs. Additional development experiments are then prioritized to complete the design space.
Smart DOE
A demonstrated understanding of the effects of CPPs and their interactions on CQAs is a requirement for an approved design space. Small-scale characterization experiments with appropriate experimental designs allow for a multivariate analysis including interactions, efficient use of data, and statistical modeling. Process characterization is often an iterative process involving parameter screening, range identification and response surface mapping. This method enables revisiting the original process development plans with the client to ensure that information gathered during early DOEs is understood and leveraged for future experiments. This is how risk is reduced and commercial timelines can be compressed. It also allows for iterations of the risk assessments.


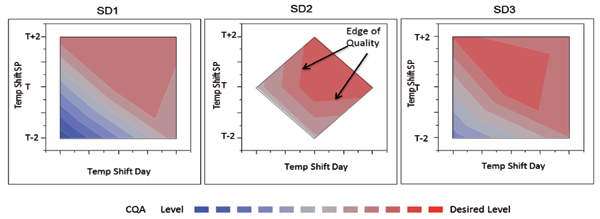
The following example shows an experiment designed to measure impact of seed density (SD), temperature shift degree, and day of temperature shift on an important CQA of a complex biologic. An on-face central composite design was employed in this experiment. The results are shown in Figure 5 along with a visual representation of the design space.
CONCLUSION
Following the CMC QbD Development Program allows definition of a design space earlier in the development program. This means that even the earliest development experiments can be built upon and leveraged as the product advances towards commercialization.

Table II contrasts the two different approaches and demonstrates the advantages of the QbD approach to development. The deliverables associated with the product lifecycle are more robust and timely. Additionally, the long-term support through the CPV program is optimal and flexible. As shown in Figure 1, the advantages can also represent a more robust timeline.
The QbD development program engages the client in a strategy to address critical issues pertaining to the product quality and the process early on. This necessitates a formal plan at the start of the development program, and both the CMO and the client need the commitment to do the work upfront. This strategy enables a seamless transition when the client and CMO push together for commercialization of the product.
Clinton Weber is associate director of BioProcess Sciences, Ashok Kumar is principal scientist, Lisa Joslin is process validation manager, and Roland Ashton, James Schmid, and Michael Larson are development associates, all in the Process Development Group at CMC Biologics, http://www.cmcbio.com/.
REFERENCES
1. FDA, Draft Guidance for Industry: Target Product Profile—A Strategic Development Process Tool (Rockville, MD, Mar. 2007).
2. ICH, Q8 (R2) Pharmaceutical Development, Step 4 version (2009).
3. A. Brindle, et al., Pharm. Eng. 32 (1) 26, 28-33 (2012).