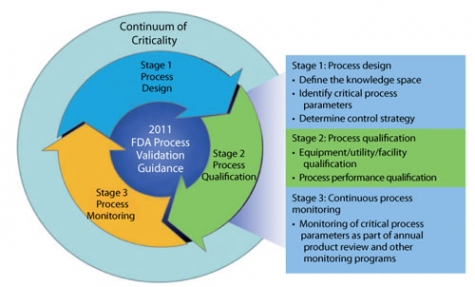
In Part I, the author used risk analysis and applied the continuum of criticality to quality attributes during the process design stage of process validation. After using process knowledge to relate the attributes to each process unit operation, the inputs and outputs of each unit operation were defined to determine process parameters and in-process controls. An initial risk assessment was then completed to determine a preliminary continuum of criticality for process parameters.
In Part II, the preliminary risk levels of process parameters provided the basis of characterization studies based on design of experiments. Data from these studies were used to confirm the continuum of criticality for process parameters.
At this point in the process development stage, the design space has been determined. It may not be rectangular (if there are higher-order terms in the models) and may not include the entire proven acceptable range (PAR) for each critical process parameter (CPP). In fact, the design space is not defined by the combination of the PARs for each CPP, given that the full PAR for one CPP ensures the quality of the critical quality attribute (CQA) only when all other CPPs do not vary. The design space represents all combinations of CPP set points for which the CQA meets acceptance criteria.
Overall, the design space developed from process characterization study models represents a level of process understanding. Like all models, however, the design space is only as good as the data that drives the analysis. The CQAs, on average, may meet acceptance criteria, but individual lots--and samples within lots--are at risk of failure when operating at the limits of the design space. For this reason, the operational limits for the CPPs are frequently tighter than the design space. This tighter space is the last part of the ICH Q8 paradigm (2) (see Figure 2) and is called the control space, which equates to normal operating range (NOR) limits for each CPP.

Stage 1: From models to design space to control space
At the conclusion of the process characterization studies, the design space describes each CQA as a function of process parameters of various levels of risk, or continuum of criticality. Additionally, these models have been confirmed, by experiment or prior knowledge, to adequately represent the full-scale manufacturing process. This classical multivariate approach combines impact from each CPP to predict the response of the CQA as each CPP moves through its PAR. These mathematical expressions can be represented graphically as either contour or 3-D response surface plots.
Even this view of the design space is too simplistic. To ensure a process has a statistically high probability (e.g., > 95%) that a CQA will reliably meet the acceptance criteria for a combination of CPP requires a more involved computational analysis. This analysis may lead to revising CPP set points and ranges.
Several computational statistical methods are available for analysis of process reliability. Each of these requires specialized statistical software.
These methods include:
• Monte Carlo Simulation inputs CPPs as probability distributions to the design space models and iterates to produce the CQA as a probability distribution. Capability analysis can be applied to the CQA’s acceptance criteria. This method is limited by the estimations of the CPP distributions from process characterization studies, which will not necessarily represent the same level of inherent variation as the commercial process. Using sensitivity analysis on these estimated distributions may enhance this approach.
• Predictive Bayesian Reliability (5) incorporates the CPPs, uncontrolled variables such as raw material and environmental conditions, inherent common cause variability, and variation due to unknown model parameters, to determine a design space with high reliability of meeting the CQAs.
Design space models often become a series of complex, multifactor equations, which are not suitable for describing the required ranges for each CPP in a production batch record. Contained within the design space, the control space consists a suitable NOR for each parameter.
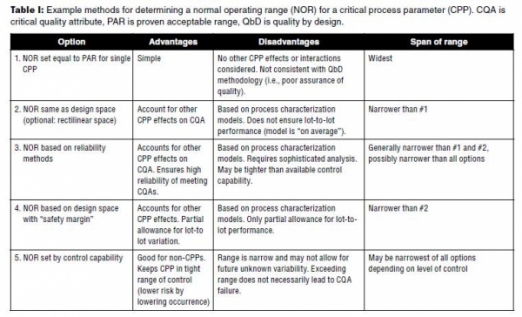
Table I provides some example methods for developing the NORs and the control space together with their advantages and disadvantages. Option 1 is included only since it represents a historical approach broadly employed in NOR establishment. This approach is not consistent with the current quality-by-design (QbD) approach to process validation and will not be sufficient to defend a final NOR establishment. Issues with Option 2 have been discussed previously. Of these three options the reliability approach (Option 3) is the most robust, but requires sophisticated statistical skills. This option may be reserved for only very high risk CPPs.

Option 4 is based on a “safety margin” that may be determined in a variety of ways. One choice is to measure how much an actual parameter will vary around its set point. For example, if a temperature set point is 30.0 °C, it may be observed to vary from 29.5 °C to 30.5 °C (± 0.5 °C). The safety margin of 0.5 °C is applied to narrow the CPP limit from the design space. Therefore, if the design space is 25.0 °C to 35.0 °C, the NOR becomes 25.5 °C to 34.5 °C. Additional factors, such as calibration error, can be added to provide a wider safety factor.
Option 5 is the narrowest method applied for determining the NOR. Here, the ability to control the parameter determines its range. For example, a pH set point of 7.0 may have a design space of 6.5 to 7.5. However, if the control of the pH is shown to be ± 0.2, then the NOR is 6.8 to 7.2. The primary disadvantage of such a narrow range is that even if the CPP’s NOR is exceeded, the CQA may not move outside of its acceptance range. Option 5 is suitable for setting the NOR of non-CPPs since the CQAs are not affected. For example, a mixing set point of 200 rpm is a non-CPP. If the mixer’s control is qualified for ± 20 rpm, then the NOR is 180-220 rpm.
The conclusion to process validation Stage 1 (process design) is documented by summarizing the control strategy per ICH Q10:
Control strategy: A planned set of controls, derived from current product and process understanding, that assures process performance and product quality. The controls can include parameters and attributes related to drug substance and drug product materials and components, facility and equipment operating conditions, in-process controls, finished product specifications, and the associated methods and frequency of monitoring and control (4).
The control strategy may be a single document or a package of several documents as described in the company’s process validation plan. This documentation includes or references the following:
• Continuum of criticality for process parameters
• Continuum of criticality for quality attributes
• The mechanistic or empirical relationships of CPPs to CQAs (design space)
• The set points and NOR for CPPs (control space)
• Acceptance criteria and sampling requirements for CQAs, in-process controls, and raw materials testing
• In-process hold (non-processing) time limits and storage conditions
• Key operating parameters (KOPs) and performance attributes (all non-critical), which are used to monitor process performance, set points, and ranges.