Screen, refine, and optimize
The advantage of a screening design is that it can handle a fairly large number of parameters in the fewest number of runs. The disadvantage is that the interaction effect of each CPP on a CQA cannot be directly determined because the experimental parameters are confounded. Confounding refers to a scientific state where there is insufficient resolution in the experiment to resolve the interaction effects from the main contributions of each parameter studied. However, at the screening stage, the objective is to eliminate as many parameters from the potential list of CPPs as possible so that the true process design space can be determined in the refining studies.
At this stage, the criticality of parameters has not yet been verified and parameter control ranges (proven acceptable range) have not yet been determined. Although it is usually the goal to meet the CQAs’ acceptance criteria to ensure product quality, the purpose here is to show how the process responds to the parameters even if the CQAs may not meet their criteria.

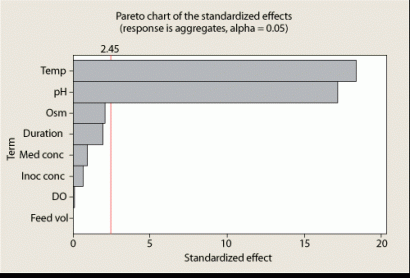
Figure 3 is an example output chart from a screening study. This Pareto chart shows the standardized effect or relative impact, for each of eight process parameters on a CQA. A reference line at 2.45 is the threshold below which the parameter’s effect is not statistically significant for this study (p-value > alpha of 0.05). In this example, six of the parameters may be screened out of further studies, provided they do not produce significant effects for other CQAs. A similar approach can be used for process performance attributes (non-CQAs) to evaluate parameters that impact process performance, but not quality; these non-critical parameters are frequently called key parameters. If these investigations had been conducted as OFAT studies, it would be impossible to quantitatively determine which parameter had an impact on the product’s CQA and to what extent. Through the use of a DOE, it is possible to measure both and define the level of variation explained by the parameters evaluated based upon the data observed.
Once the screening DOE has been completed, parameters that have not shown strong responses to any of the CQAs are now kept constant or well controlled to reduce the number of parameters for refining studies. By employing a full factorial design, all main effects and interactions are separated with regard to the CQA responses; there is no confounding in a full-factorial design. Center-point conditions (runs at the midpoints of all parameter ranges) are recommended because they can be used to detect if significant curvature (non-linear relationship) exists in the response to the parameter and they provide replication to determine the inherent variability in the study.

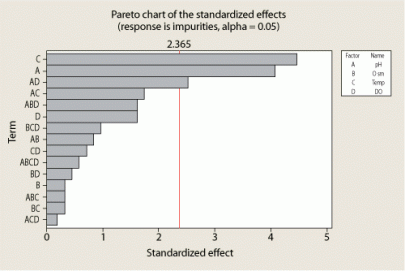
Figure 4 is an example output chart from a four-parameter, full-factorial study. The Pareto chart shows a threshold line. Two parameters and one two-factor interaction are statistically significant for this CQA. All parameters and interactions below this threshold are not statistically significant and their effects have no more impact than the inherent run-to-run variation.